If you are a project manager, you want to use the right tools to do your job. What about project management with Excel? What can you do with it? Can you use Excel to replace more advanced and expensive software? In this guide, we will explain how to use Excel for project management – not just to create Gantts, but all kind of tools that a Project Manager may need.
Project Management with Excel
Rethinking Excel
Most people in business have a love-hate relationship with Excel. This does not have to be the case if you have the right expectations about this tool. Here, we are generally referring to Microsoft Excel, however the same can apply to Open-Source tools or Google Sheet.
Think about Excel like a system to organize data, that is very flexible and hence somewhat prone to errors. With rows and columns, numbers and formulas, you can represent pretty much everything through an Excel file. However, Excel will do just what you tell it to do, nothing more than that. As such, it is very prone to error: it will not tell you if you are putting your data in the wrong cell. This is because Excel is like a blank sheet, it does not know the rules of drawing: you, as the painter, should know them and use them.
This problem can grow exponentially as the file is more and more complex, particularly if multiple people work in the file – regardless of what the file does. Hence, you should try to make things simple and clear as much as possible.
With this in mind, we can dive into project management with Excel and see what things we can do with it.
Why Project Management with Excel?
Unlike many other guides out there, we will not tell you “yeah, project management with Excel is good, but if you buy our expensive tool instead…”. No, we will tell you things the way they are. The truth is Excel can be the only tool a project manager needs. However, some things it can do naturally well, others it was just not designed to do, so they will be more cumbersome.
Why project management with Excel? Here are a few ideas:
- Often the cheapest alternative
- Extremely widespread software, anyone can open an Excel file
- Since no special software is needed (e.g., Microsoft Project), all team members can open and edit Excel files, and they can be exported to customers
- Since Excel has no hardcoded project management rules, you set the rules of the game and customize your project management
We are not necessarily advocating to use Excel instead of other tools. Quite the opposite, Excel can often complement other tools. Our job with this project management with Excel guide is to present you with all the beauty and possibilities Excel has to offer, so that you can make an informed choice on the tools you use.
Project Management with Excel Files
A project manager has typically several duties, that can be addressed working in Excel to some extent. Typically, we see a project manager do the following things:
- Plan the timeline and schedule of the project
- Manage the costs and resources and people involved
- Benchmark the status against planned costs and timeline
- Identify risks in the project
- Collect metrics about the project and produce reports on those metrics
All of this can be done through a combination of Excel files, that we will see how to create right now.
Gantt Chart with Microsoft Excel
Probably, the Gantt chart is the most widely used tools in project management. We can create Gantt chart in Excel as well – they may not be as “beautiful” as in other tools, but they definitely get the job done. Actually, they do their job even better than Microsoft Project in some contexts.
This guide is about project management with Excel, and not about teaching project management itself. So, if you do not know the Gantt chart you may want to read What is a Gantt Chart? first.
How to create a Gantt Chart with Microsoft Excel? The idea is simple: we divide our Excel sheet in two parts. On the left, we have the details about our activities, such as activity name, ID, and most importantly start and end date. We should have one activity per line. On the right side, we leave space to “draw” the Gantt Chart. I say draw because, in reality, we are only coloring cells.

To do so, we need to define our minimum unit of time. Since time is represented horizontally, our minimum unit of time is the column: we can say one column represent one day, one week, or one month, depending on the need of our project.
At this point, we are able to do let the magic of Excel formulas do the job. In the top row, we have the date representing the current period. If start date of the activity is before the date at the top it means the activity has already started. Instead, if the end date of the activity is after the date at the top, it means the activity has not finished. Hence, if the activity has started and has not finished, we can paint our activity. To do so, we simply make our formula return 1, and use conditional formatting to paint activities that are 1.
=IF($C4<>0;IF(AND($C4<=I$2;$D4>=J$2);1;"");"")In C4 we have our start date, and in D4 we have the end date. Instead, J2 contains the current date represented by the column. Note that we lock C with the dollar sign for the rows and 2 for the column.
If you don’t want to recreate this Excel for yourself, you can always download it here.
At this point, it may seem that this is a down-played version of Microsoft Project. That is because it is, the most basic version that could interest everyone. Nonetheless, Excel can actually be more powerful that Project in doing Gantts. Yes, you read it right. With Excel, you can color your bar the way you want, and even change the color of the bar over time. For example, if an activity goes through various stages (say, planning, implementing, validating), you can color parts of the bar differently just by tweaking the formula.
Project sets you a lot of rules. Excel does not set any rule: you create the rules. This is why we love doing project management with Excel.
Tracking Work with Microsoft Excel
Anyone knows how much we love checklists. They are a simple and neat way to remember everyone what needs to be done, and to let people quickly mark what has been done so far. You can do checklist with many tools: Google Keep, Todoist, Evernote, Microsoft To-Do… and what about Excel? Since this is a guide about project management with Excel, it is no surprise that we can do checklist with Excel indeed.

This is so simple. You just create a table and have an activity in every row, typically with name and description. Obviously, you also want to add a field where you can mark “Complete” when the activity is done. I like to call this field “Status”, so we can take our checklists to the next level.
At the basic level, an activity can be either complete or not. However, we may expand our status to:
- Not Started
- In Progress
- On Hold – waiting for someone
- Completed
- Not Needed Anymore
And more, you can personalize the status that you want. Another important field you should consider is the estimated effort in hour. Ideally, each activity in a checklist should last between 2 and 8 hours, so that it can be managed in a day. In addition, you may want to have special “zero duration” activities that are just reminder to do something extremely quick, such as sending an email.
Once you have all that, you should put your checklist in a shared place other people can access. If you are doing project management with Excel, you may have OneDrive – that’s a good place to put your checklists and share them with the rest of the team.
Why all this fuss, when there are apps dedicated to checklists? Because you can then integrate your progress automatically into your other project files.
Automatically Track Project Progress – the best Project Management with Excel Tip
You read it right – this is the best project management with Excel tip you could ever receive. You have your checklists, you have your Gantt. You can now let your team work on the checklist, and automatically update the progress of your project accordingly. All of this exclusively with Excel (plus OneDrive, for the shared content – a local shared folder is also fine). How do you do that? Let’s see.
For all of this to work, you need to have all your checklist and Excel files in a shared folder, or even better in OneDrive or Sharepoint, as this will make things much easier. Then idea is that you will have a master Excel that will collect data from all other Excels to produce statistics. You, as a project manager, will work and look at the master Excel. The team will work on a day-to-day basis on all other Excel files, and you will be able to see updates in near real-time.
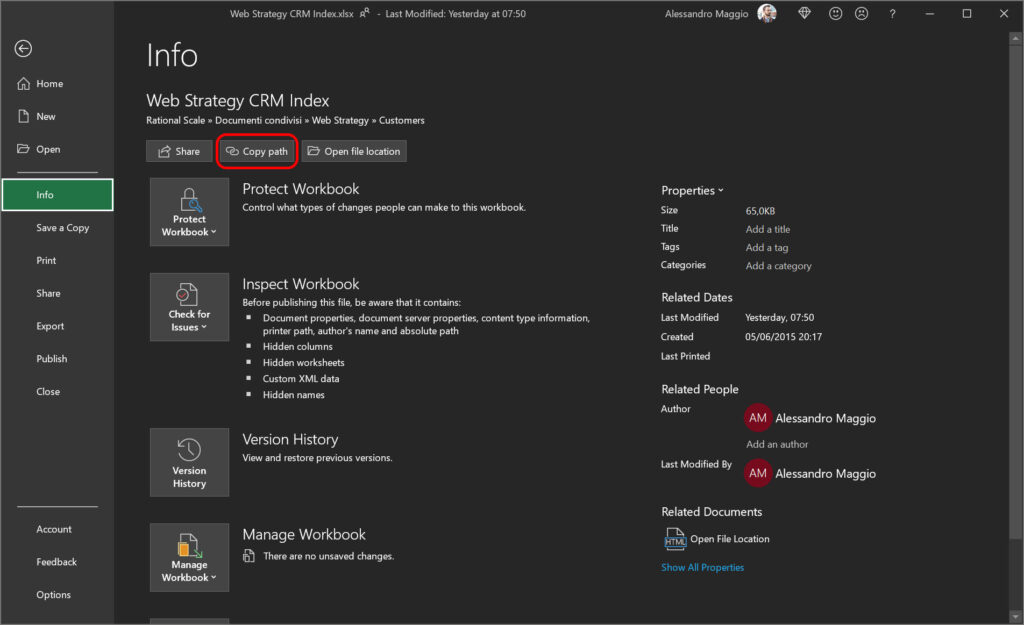
All this means that the master file will reference the other files: it will connect to them and read their data. We need to tell it how to connect to them. To do so, you need to open your checklist file (not the master file), and go to File > Info > Copy Path.

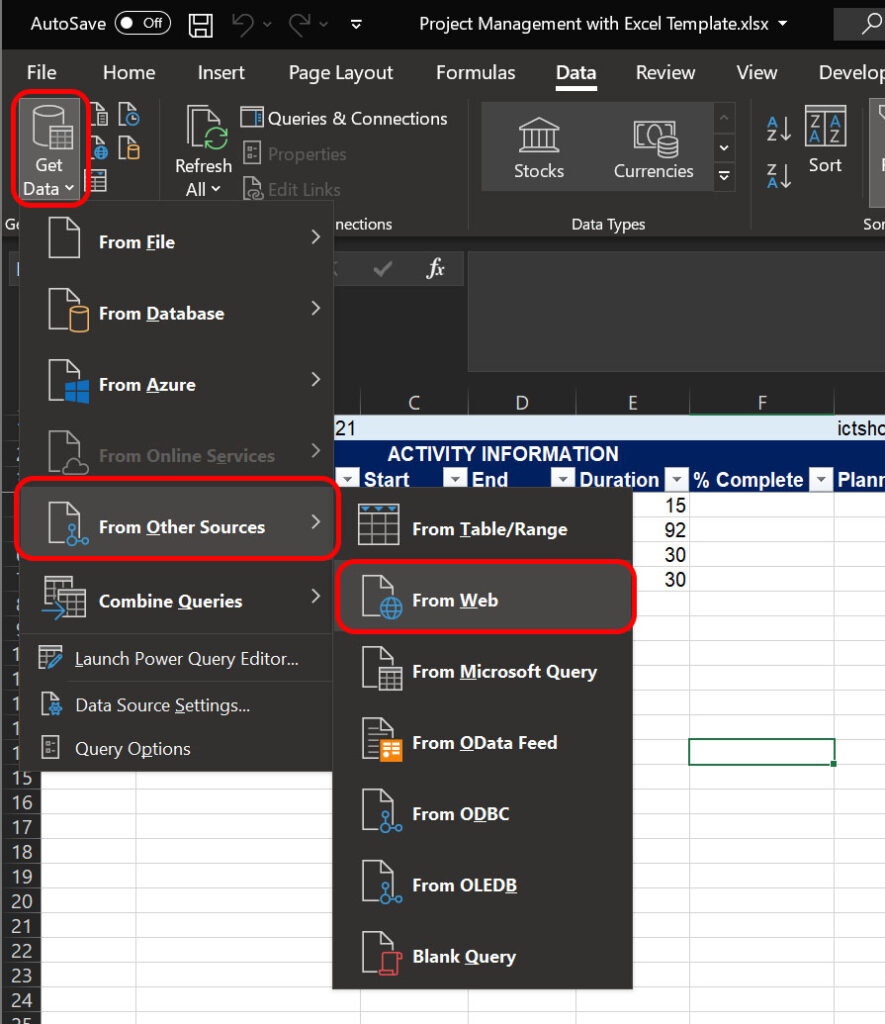
Now we have copied the reference to our file. We then need to go to our Master file and paste this reference. We do this in Data > Get Data > From Other Sources > From Web. Note that this applies to OneDrive and Sharepoint only, if you have a shared folder you need to use “from folder”.

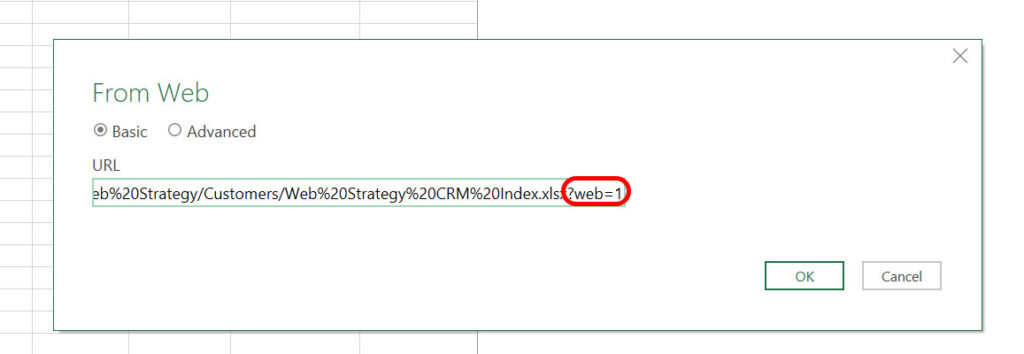
Now, all you have to do is paste the URL you copied from the previous file, but remember to remove “?web=1” at the end, because this is a flag meant to make the file user-friendly. Here is not a human to read it, but Excel, so it will not work.

Now, Excel will ask you what data to import from the source file. If you have tables defined, you can import tables (recommended). Excel will finally make a linked copy in your master file. Now, you can use this data to compute the status of your project, for example.
One way I use this, for example, is to count all the items in a checklist that are complete and weight them by their effort, and then divided that by the total effort of the checklist. In this way, I can obtain the accurate percent complete of the checklist. If then you have one checklist for each activity in your Gantt, you can easily apply this as “Percent Complete” to that activity.
Amazing, with just some cleverness and Excel we were able to go above and beyond features of expensive project management tools.
Project Management with Excel in Summary
All in all, Excel was not designed for project managers specifically, yet it does the job quite well. If you are looking for the quick and dirty, or simply the customized way to run your projects, then project management with Excel is worth checking out.
As you can imagine, Excel is a complex tool used in many disciplines from financial modeling to statistics and Data Entry. We cannot possibly cover all the possibilities it has to offer to project managers, also because project management itself is a broad discipline. Instead, we hope this article set the stage and sparked some curiosity about what you can do when doing project management with Excel.
Just like in life, the only limit is your creativity.