
Most people may wonder “what is a Gantt Chart?” and what its uses are. A Gantt chart is a bar chart in a horizontal state important in project management to symbolize a long-term project plan graphically. Contemporary Gantt charts usually show the user timeline and condition, including the person in charge of every task in the project.
That is to say; a Gantt chart is the simplest way to communicate everything it takes to complete a project at the right time and at what amount. It is a great way to communicate the status of the project to your stakeholders and project staff.
What is a Gantt Chart?
Definition of Gannt Chart
A Gantt chart represents the timeframe of a project. The horizontal axis indicates the timeline, and the vertical axis represents the number of projects to be completed.
Every activity is located on the left side of the chart. The situation and duration of that bar depend on the duration of the activity and timeline, the starting time, and the completion time.
Generally, the Gantt chart enables us to know;
- How is a project divided into tasks?
- What time every task starts and ends
- The duration every task will take
- Who’s responsible for every task
- How is every task linked to the other?
- Whether there are any meetings, approvals, or deadlines to happen
- How is the project progressing?
- The entire project plan from the start the beginning to the end
How to Use a Gantt Chart?
The principal function of a Gantt chart is to show which tasks can be done concurrently and which ones should be done after another. By combining this with the project resources (that is, people and equipment), we can identify the difference between doing excess or less work, the cost, which may involve using a lot or minimum resources, and the time duration of the project.
Including more resources or minimizing the scale of the project, the project manager can preview the result on the final date. To design a chart, it is crucial to know the specific tasks needed for a project to be complete, assess what period every task will take and what tasks depend on others.
The process of compiling this data into one will assist the project manager in concentrating on crucial sections of the project and start to identify an accurate timeframe for its completion.
How Does Gantt Chart look like?
Interpreting a Gantt chart depends on how we understand how different components integrate for a Gantt chart to function. Gantt chart has nine main components for smooth project management. They are:
- Dates
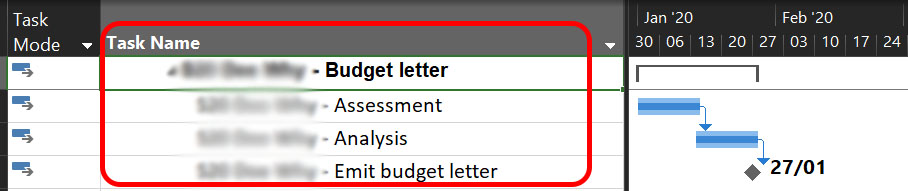
- Tasks
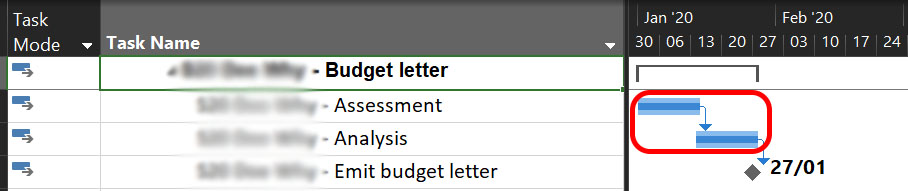
- Bars
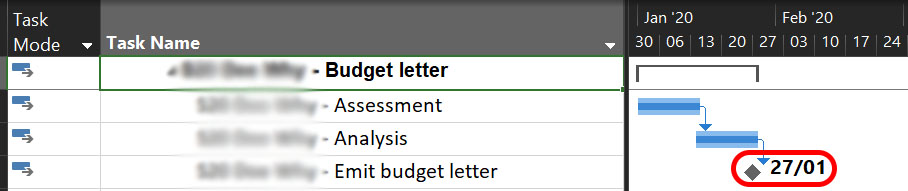
- Milestones
- Arrows
- Taskbars
- Vertical Line Marker
- Task ID
- Resources
Benefits of Using Gantt chart in Project Management
- Know what’s taking place within the project
- Better communication and team cohesion
- Prevent resource overload
- Evaluate the progress of the projects
- See overlying activities and task dependencies
- Experience more clarity
- Practice better time management
- Work with remote team members and motivate them
- Develop a sense of accountability
- Improve flexibility
- Boost transparency

Components of a Gantt Chart
The best way to show the components of a Gantt Chart, to understand what is a Gantt chart, is to take a look at a real project. This diagram was created using a real-world tool: Microsoft Project.
Dates: The date is one of the major components of a Gantt chart, and with it, the project management team will know the beginning and the end of the whole project and when every project will occur. The dates occur along the top part of the chart.
Tasks: Huge projects always have big numbers of small tasks. Project managers use the chart to follow up on every small project not to forget or delay anything. Tasks occur along the X-axis.
Bars (or “taskbars”): After identifying all the sub-tasks, we use the bar to display the duration it will take to complete each task. This is important in ensuring each sub-task is performed as planned to enable the whole project to finish at the right time.
Milestones: Milestones are those activities that are important to complete a project successfully. Unlike other small details that need to be done, finalizing a milestone makes us satisfied and gives us the way forward. The milestones on a Gantt chart occur as diamonds (or different shapes at certain times) below each taskbar. A milestone has a duration of zero, it is just a crucial point in time that summarizes what we have done up to that point.
Arrows: Though we distribute most of our tasks at different times, some should be completed prior to or after a preceding sub-task begins or ends. These activities are displayed using a small arrow amid the taskbars on the chart.
Color or percentage complate on the task bar: Though it may take us a short duration to complete multiple sub-tasks, sometimes we will have ample time to preview how the project is progressing. Development is indicated by coloring the taskbars to symbolize the section of every task that is already complete.
Vertical Line Marker: Using a vertical line marker is an important aspect of project management. With it, we can monitor how the project is developing, and it shows the current date on the chart. It helps manage time effectively since we can see in advance the amount of work we need to do and whether we are on the right path to finish the project on time.
Task ID: The current business world is moving faster, and sometimes we have different tasks taking place at the same time. Incorporating a task ID on a Gantt chart helps all the parties involved to recognize the task you are referring to. Each task ID should be unique, so that no two tasks have the same ID, for easier identification. This is useful if we have systems to automate the dispatch of work.
Resources: Though not each Gantt chart indicates the names of participants involved in it, it is crucial to list names and their specific duties if a project needs different people to complete. Recognizing and delegating resources to individual tasks is vital in helping manage people properly and know the tools and skills required to finish each project at the right time. For example, you may write next to an activity that John is in charge of doing so, or that a “Software Developer” is the one responsible, without naming names.
How to Create a Gantt Chart
Step 1: Start with a project or initiative in mind
In the beginning, we are never sure how long a project is going to take place. An example is when we want to start a new employee training program, but we’re unsure what is required to make it successful.
Step 2: Assess the current plan for this project in place
It is important to look at every step involved, from the start to roll out, to have a clear knowledge of all the people who will participate. This is what you’ll require to identify timelines.
Step 3: Determine which tasks are dependent on one another
At times we take the same time to complete some tasks, yet others cannot start before the first ones are completed. This knowledge helps us understand the duration each task takes and when the steps should occur. Put it simple, if we are building a house we cannot paint the wall before we actually build the walls. Those are dependencies, and we need to account for them when positioning our task bars in the chart.
Step 4: Compiling tasks into time frames in a Gantt chart layout
If you don’t know what is a Gantt chart, this is the most important step. It is crucial in helping us to enter and finish tasks, and it spontaneously creates the Gantt chart for anyone to see the time each project needs and share it throughout the company. It is easy to realize that some tasks are too demanding at this step, and it is better to break them into milestones.
Step 5: Adding extra information, accountability, budget, description, etc.
It is very important to add information that viewers can use to understand every aspect of the project. The only problem here is that it’s not easy to keep the gnat chart tidy, and there is limited space for analysis, descriptions, or commendations. Some tools can be used for this and help to create a comprehensive page for every feature which may be included in the report and controlled if need be. (According to us, we see this as very essential for project management meetings.)
Step 6: Break down the budget
Now that everything is according to plan and it’s now easy to understand a gnat chart, it is crucial to begin sectioning the budget depending on milestones. After setting the budget aside, it is important to clearly see whether the designated budget will or will not complete the project.
Step 7: Assign ownership
Each section of the project should have an owner. When individuals are responsible for a task, they will make sure it is done on time, and it’s of good quality. It is essential to include their names as contributors on the Gantt chart if different people are involved.
Step 8: Continue to use the Gantt chart as a reference.
As time progresses and the project is still ongoing, it is crucial to use the Gantt chart as a reference often. It helps to evaluate the present condition of various constituents and identify what these statuses signify to accomplish a project. That is why a gnat chart is essential because having a preview of how everything is happening will be very helpful in the future. In other words, just take a look at the diagram software and try to update it often as the project progresses.
What to learn more about the technical steps? Check out this amazing guide by Clear Point Strategy.
Gantt Chart Generators & Software: What to Look For
We view the Gantt chart as an awesome and important tool for a project management tool for our projects since it keeps the sub-tasks and milestones in order. It is therefore vital to consider creating one because everyone now understands what a Gantt chart is. Having a Gantt chart generator or tool enables charts to be very detailed and provides instant updates. Tools and generators basically enable us to have plenty of fields than a basic excel chart can comprehend, which may include fields.
One of the most famous tools you can use is Microsoft Project, that however is somewhat expensive and limited. Many other online alternatives have popped up in recent years. However, you need to know what to look for.
Below are some of the features we recommend for certain project management activities:
- Ability to track status and percentage complete
Changing the colors of the bars on the Gantt charts (depending on the condition of the project) is a particularly important thing. There are gnat Gantt generators and tools that update the condition and percentage completed instantly, which is perfect. It is good to check whether this feature is included. - Ability to show visual aids within a chart
Besides bar colors, there are other visual aspects to get from the Gantt chart using advanced tools. Others have the potential to indicate outline indentations, like indicating if something is a main milestone or sub-milestone. Basically, many things take place in a Gantt chart, and it is important to have as smooth meetings as possible. We, therefore, insist on the importance of having a properly designed Gantt chart that is easy to understand. - Ability to show dependencies
We consider most and watch out for the ability of the chart to indicate that one milestone relies on the next one for its completion. For example, milestone B relies entirely on milestone A to finish, and milestone A is behind. The beginning of milestone B gets updated accordingly and gets delayed too. This may not be important to individuals but may be important for the company. Hence it’s worth noting
Summary: What is a Gantt Chart
In better terms, to understand what is a Gantt chart, it is a graphic demonstration of project plans. The project activities are indicated in the arranged bar chart to symbolize finished tasks, tasks in progress, and tasks awaiting. Every task in the chart is decorated with a different color to distinguish the percentage of tasks to signify the position.
Advanced Gantt charts have navigation bars to move the features in charts. The scroll bars are important in directing and exhibiting the useful objects on the chart. Some charts can also show additional metrics like project and milestones dividers on the chart. Gantt chart can also show the total sum by phases, projects, or milestones. In a nutshell, a Gantt chart is a graphical outline important in project management to show how much time it takes to complete a project depending
Where do we go from here? If you are a project manager, you will most likely want to learn how to better manage your projects. This goes well beyond understanding what is a Gantt chart. Don’t worry, we got you covered: learn how to better influence your team to achieve outcome with this guide on referent power.
