
We already know how the story goes: data is the most valuable asset. In fact, good data enables good decisions. In turn, good decisions make businesses thrive. Thus, all companies carve for data, and logs are a good place to dig into. AWS CloudWatch allows you to do just that, but you need to know how to use it. In this post, we will see how to write the perfect AWS CloudWatch Query to get what you’re looking for.
New to AWS? You may want to check How to use AWS with a 5 minutes tutorial first. In this post, we will assume you already have touched AWS somehow.
Your first AWS CloudWatch Query
What is AWS CloudWatch, anyway?
If we go to the official AWS website, it says that CloudWatch is monitoring and observability service. While this may sound complex, it just means it is a service to hold and browse logs.
A log is just a piece of information any of your systems may generate when an event happens. For instance, you may generate a log when a user logs to a server, when it makes an HTTP Request, but also when the server reboots and so on.
However, having the log only in the place where it generates is pointless. You will have many services in your infrastructure, and they all generate some kind of log. You want to have a single place where you can see all the longs. AWS CloudWatch could be that place.
All AWS Resources support natively logging to CloudWatch, meaning you don’t have to configure anything. However, you need to make some configurations so that your on-premises systems can send longs to CloudWatch. Furthermore, you may want to send your own custom application logs to CloudWatch. That is also possible because you can generate a new log in CloudWatch with an HTTPS request.
Once you have all your logs in AWS CloudWatch, we can start querying!
Browsing the logs
Open the AWS Console and select the CloudWatch service (or search for it). Once inside CloudWatch, you will have the following menu on the left. You have two places where you can go, all in the Log panel: Log groups and Log Insights.
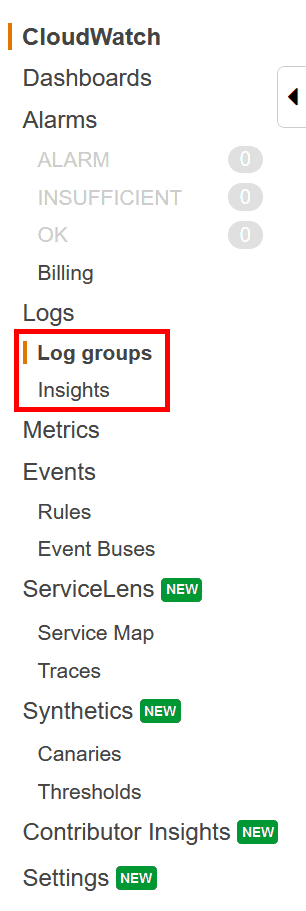
Remember this:
- In the Log group, you can see your raw logs and open each record manually. It is useful if you want to understand the format of your log, like which fields it contains.
- Instead, in the Insights section, you can make custom queries to actually search for a specific log.
The purpose of this tutorial is to show you how to make an AWS CloudWatch Query. Thus, we will focus on the Insights section, but you may want to check your Log groups first in order to understand what your own logs look like.
Make an AWS CloudWatch Query
Navigate in the Insights section. A query editor will appear, with a basic default query in it.
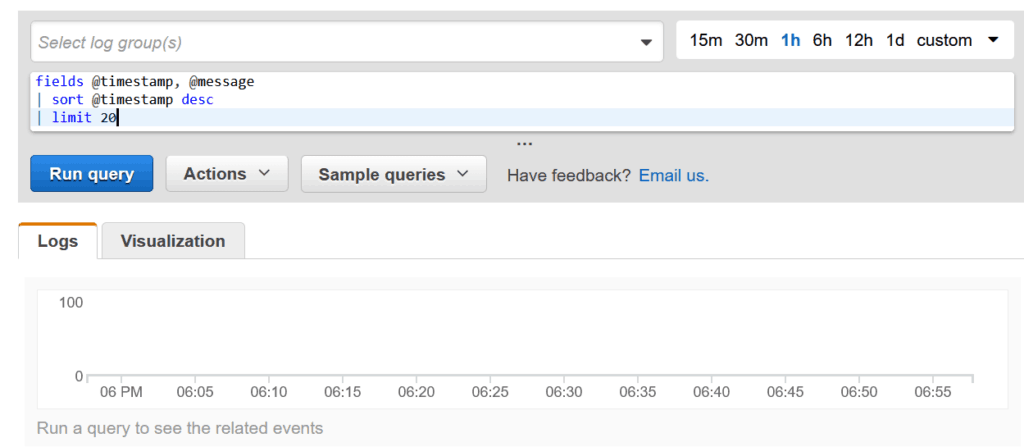
AWS organizes logs in groups so that all logs from the same system will be in the same group. Here, you can select at the top which log group you want to query (or all groups if you leave it empty). On the top right, you can select which time range to query, so that you see only logs related to a specific time.
At the center, we have the query, that we will see in the next chapter.
At the bottom, we have the list of lost and the data visualization in a chart. The visualization is simply a chart of bars over time. The higher the bar, the more logs you have at that specific time. Most recent time is at the right, while the oldest one is on the left.
This AWS CloudWatch Query editor is pretty simple to understand. What’s more tricky is the query you have in the editor. It is time to see what it looks like.
How to write a query
AWS Cloud Watch Query syntax
In case you are familiar with Splunk, the AWS CloudWatch query syntax follows a similar logic. We can start with the default query.
fields @timestamp, @message
| sort @timestamp desc
| limit 20
This query is fairly simple to understand. It takes the field @timestamp and @message from the log (and doesn’t show the others). It sorts the logs based on time in a descending manner, so that the newest are on top, and shows only 20 logs.
Here we can see that we write queries by piping operations. In other words, we are manipulating the raw log in multiple ways before presenting. The result of each manipulation is passed to the next one until we finish all manipulations and present the log. We do this by using | (pipe). It basically means “take the result of what’s on the left, and do this”.
So, we have three separate operations in this example.
fields @timestamp, @messagesort @timestamp desclimit 20
One thing is quite important to remember here. Some operations are streams because you can execute them log by log (e.g. removing a field). Other operations, instead, require all the logs to be processed before being executed. That’s the case of sort, it needs to know all the logs before sorting them.
Now that you understand the structure, we can dive into the different operations.
AWSCloudWatch Query Operations
We already saw three operations that we can recap.
fields <field list>shows only a list of fields from the log. It refers to the predefined AWS fields, so if your application log has some format with multiple fields, you can’t use them here. All your application logs will be inside the@messagefield. Don’t worry, we will see how to deal with that.sort <field> <asc|desc>reorders the logs in the way you’d like.limit <number>gets only the number of logs you specify, and stop processing others.
Now, we can introduce some nice new operations.
Filter
The filter operation allows you to get only logs that match a specific format. You typically want to filter on the message, and you can use regular expressions. The syntax is the following.
filter <field> <operation> <value>For example, we can do the following.
filter @message = "all good"But also regular expression if we use the like operator.
We can take a real-world example. Imagine you log your custom application that does a backup of your AWS Route53 configuration. That application generates logs in the following format.
zone_id="ictshore.com" message="backup is ok" backup_name="ictshore.backup.json" has_error="false"Of course, parts of the message change from log to log. Thus, we can use the following regular expression to match only logs that follow this pattern.
filter @message like /zone_id=".+" message=".+" backup_name=".+" has_error=".+"/Parse
Parse is your best friend, and if you are looking how to parse messages in AWS CloudWatch that’s the place you should be looking at. As we said previously, all our nicely formatted application log is simply text in the @message field. We don’t want that, we want to restore all the fields our application log had, and search for them. Well, parse is the instruction to use. The syntax is simple.
parse <regex> as <field list>Each match of the regular expression will go into a field of which you define the name. Of course, the first match will correspond to the first field name, like in the following example.
parse 'zone_id="*" message="*" backup_name="*" has_error="*"' as zone_id, msg, backup_name, has_errorOnce we do this, we can pipe after this operation other operations that can now work on the fields we defined.
Stats
This operation allows you to gather some statistics instead of showing the log. For example, you may want to get the count of logs that match the previous queries, or the sum of a specific field.
stats count() by bin(5min)In the example above, we get the count of matches on a chart where the smallest unit is 5 minutes.
Query examples
Below, two complete query examples that will help you grasp the concepts behind querying inside AWS CloudWatch.
The following query shows how many backups have succeeded (has_error = 'False').
filter @message like /zone_id=".+" message=".+" backup_name=".+" has_error=".+"/
| parse 'zone_id="*" message="*" backup_name="*" has_error="*"' as zone_id, msg, backup_name, has_error
| fields @timestamp
| filter has_error = 'False'
| stats count() by bin(5min)
Instead, the following query produces a similar result but gets only the backups where was no change since the previous backup. It does that by querying the message field after having extracted it with parse.
filter @message like /zone_id=".+" message=".+" backup_name=".+" has_error=".+"/
| parse 'zone_id="*" message="*" backup_name="*" has_error="*"' as zone_id, message, backup_name, has_error
| fields @timestamp
| filter has_error = 'False'
| filter message like /Backup suceeded, current configuration is identical to the one already in backup.+/
| stats count() by bin(5m)
In Conclusion
Writing an AWS CloudWatch Query is probably easier than it seems. In this CloudWatch tutorial, we saw just that, and we have introduced you to the query language. Now, it is up to you to create a query that is meaningful for your logs.
A bonus tip: the logs we use in the example are generated by a custom Lambda function that does the backup of Route53 domains. If you want to look at the code behind it, you can check this interesting article on AWS Route53 backups.
